The future of open data and its use in the insurance industry
During the last 3-4 years we have seen emerging data analytics startups in all industries including the insurance sector. Data analytics departments have been created or received investment and we have no doubt about the power of data. Quality and origin of the data are the most basic aspects to consider when working with any kind of data set. We need these two factors to be clear and manageable before adding any complexity. For an insurer, data can be divided into two: internal and external.
In the INFINITECHinitech consortium, in cluster 5 and in Pilot 13, Wenalyze brings all its know-how to optimise and improve the use of open data in the insurance sector and how it helps to better understand the customer, to optimally select risks and to be able to recommend insurance products that are adapted to the reality of the companies at each moment of their activity. This post will dive into the power of external data (open data) and how its high quality can help improve loss ratio levels.
Whats is open data?
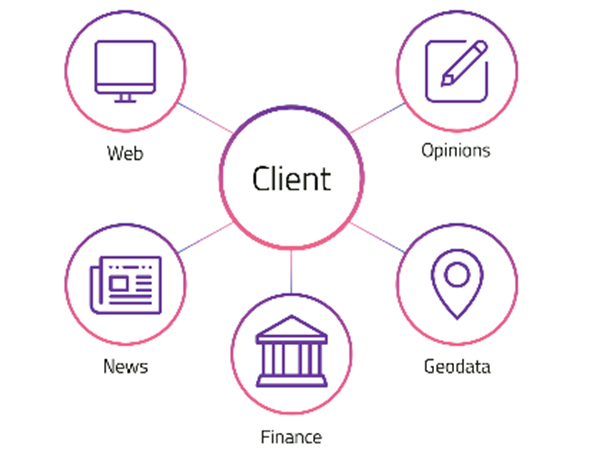
In commercial insurance, open data refers to the information related to our business customers that can be found publicly on any available website or source.
From timetables to the number of employees, external data can not only include information related to many of our current underwriting rules but also offer an insight that goes beyond.

What kind of Open Data can be used to improve the loss ratio?
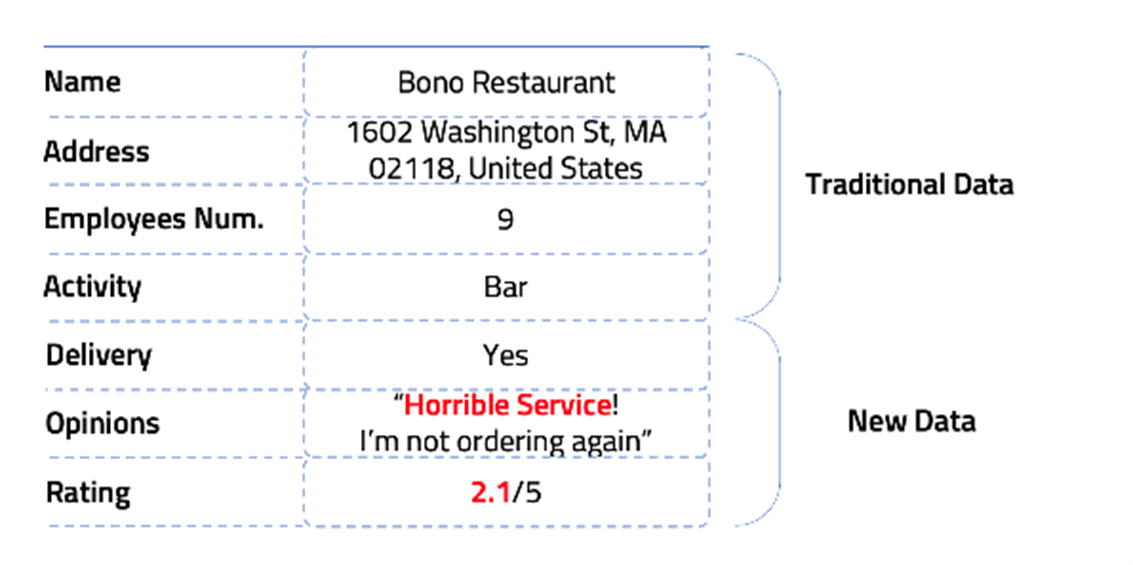
Traditional and new data.
- Traditional data: data points that are also currently being used in actuarial and pricing models.
- New data: online opinions, online reputation, management risk, etc. New types of data points are also related to the business risk but not being currently considered by many insurer
How can traditional data be improved?

Before building complex models, the current processes must be improved. According to Accenture[[1]], 15 to 20 percent of the critical data insurers collect from brokers and agents is wrong. Based on Wenalyze experience, this number is 15 to 35 percent higher when it comes to SMEs. Therefore, many of our current clients may be insured under a premium that does not suit their real risk. Open data can help fix this problem. How? By collecting updated data and replacing our current wrong data.
A vast majority of businesses can be found online in one way or another. Many of them want to be found by their potential clients and the information they publish is kept up to date, but they can also be found in public registers that contain official and updated information. And even their clients may confirm in their opinions if this data is reliable or not. "This shop is not here anymore" we have read many times.
Open data can include the same type of data underwriters need: name, address, number of employees, and business activity.
How can insurers implement new data?
Once our current data has increased its quality, we can start with the complex part. New data can be related to the risk of the business. Actuarial and pricing managers will need to confirm this before implementing it into their models. In order to explain this part, please allow me to serve you a drop of Wenalyze's secret sauce.
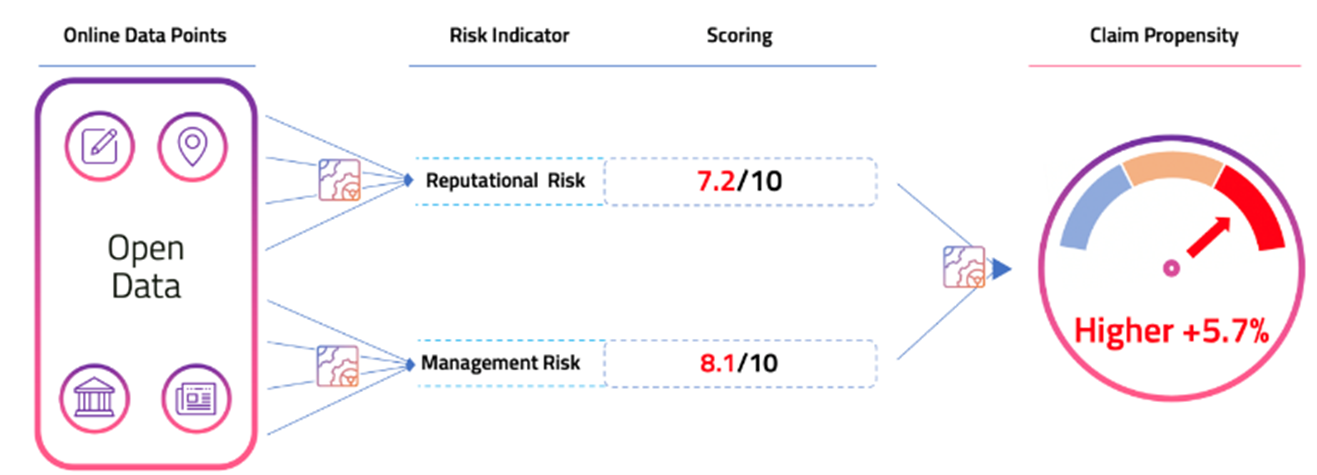
Wenalyze system builds risk indicators that help to classify businesses by risk levels. For example, we obtain a scoring for an indicator called Online Opinions. These are some aspects that this indicator contains: date of the opinion (recent vs old), rate of the opinion (high vs low), source of the opinion (google vs yelp), identified keywords ("horrible" vs "awesome"), opinion's author (verified vs non-verified), and up to 14 more data points are blended to give this risk indicator a value from 0 to 10.
Besides Online Opinions, many other indicators are processed by Machine Learning which does its magic and finds what risk indicators are correlated to claim propensity levels. Insurers we worked with were able to see that adding this type of data in their pricing models enabled them to increase the accuracy in which they could predict a claim, and therefore, improve risk selection.
Conclusion & Results
Open data can help improve current data quality and allow insurers to underwrite with increased accuracy. Adding to pricing models new indicators that are also related to the risk will also increase insurers' claim prediction models accuracy. With a higher claim prediction, premiums offered to both current and new customers can be adjusted to improve the loss ratio portfolio balance.

By applying these methods, we have seen a 3% loss ratio improvement in a portfolio of a commercial insurer and it can still be higher. From a competitive point of view, a better risk selection will allow insurers who adopt these technologies to underwrite the best risks, while their competitors, in case of not counting with this type of solutions, will be accepting worse risks by ignoring it.
We invite you to find out more about our pilot on Alternative and automated insurance risk selection and insurance product recommendation for SME’s”, within the consortium initiative INFINITECH “The Flagship Project fo Digital Finance in Europe” en https://www.infinitech-h2020.eu/
[1] https://insuranceblog.accenture.com/brilliant-basics-how-to-improve-the-core-of-underwriting-in-small-commercial
